TikTok analytics can change the way you succeed on a platform with over 1 billion active users. TikTok has become one of the world's most popular social media apps. Your performance data holds the key to standing out from the crowd.
The platform helps 79% of its users find new brands. More than one-fifth of TikTok's shoppers buy products "all of the time." Many creators find it hard to understand their TikTok insights or access their analytics. The TikTok analytics dashboard is a great way to get information about your performance. Users often wonder what these analytics show and how to interpret them correctly.
This piece will guide you through the essentials of tracking your performance. We'll show you how to exploit everything from video views and follower demographics to engagement metrics that update daily. These insights will help you create content that appeals to your audience. Your chances of growth are substantial when you track the right numbers, with engagement rates between 4.5% and 18% (depending on follower count).
Want to use analytical insights to boost your TikTok presence? Let's tuck in!
What TikTok Analytics Shows and Why It Matters
TikTok analytics goes beyond simple numbers. It's a powerful tool that shows how your content performs on the platform. These metrics help you learn about your audience, their content preferences, and peak activity times.
The power of informed content
The TikTok analytics dashboard reshapes how you create content. You can make smart choices based on real data instead of guesswork. Analytics isn't just about watching numbers go up. The information helps you shape your content better.
Regular metric analysis reveals patterns in your best-performing videos. Your tutorials might get more interaction than daily vlogs, or shorter clips could keep viewers watching longer than extended ones. On top of that, these numbers show what makes a video successful, so you can repeat those winning elements.
Growing your audience through analytics
TikTok insights paint a clear picture of your viewers. The platform shows audience details like age, gender, location and times when your followers are most active. This knowledge helps create content that appeals to your specific audience.
Understanding what TikTok analytics display becomes valuable to explore traffic sources. TikTok's algorithm actively promotes your content if most views come from the For You Page. You can also track:
- Total views and engagement rates for reach measurement
- Video watch time to spot viewer drop-offs
- Follower growth to track account progress
- Search terms showing how people find you
Core benefits for creators and businesses
Reading TikTok analytics properly offers many advantages. Creators can see exactly what their community likes and make more of it. Businesses can spot their ideal audience and measure ROI effectively.
The platform shows when followers are most active, which helps schedule posts at peak times. This substantially increases your chances of reaching more people. Smart content creation and timing choices can boost engagement rates and follower growth over time.
How to See TikTok Analytics on Mobile and Desktop
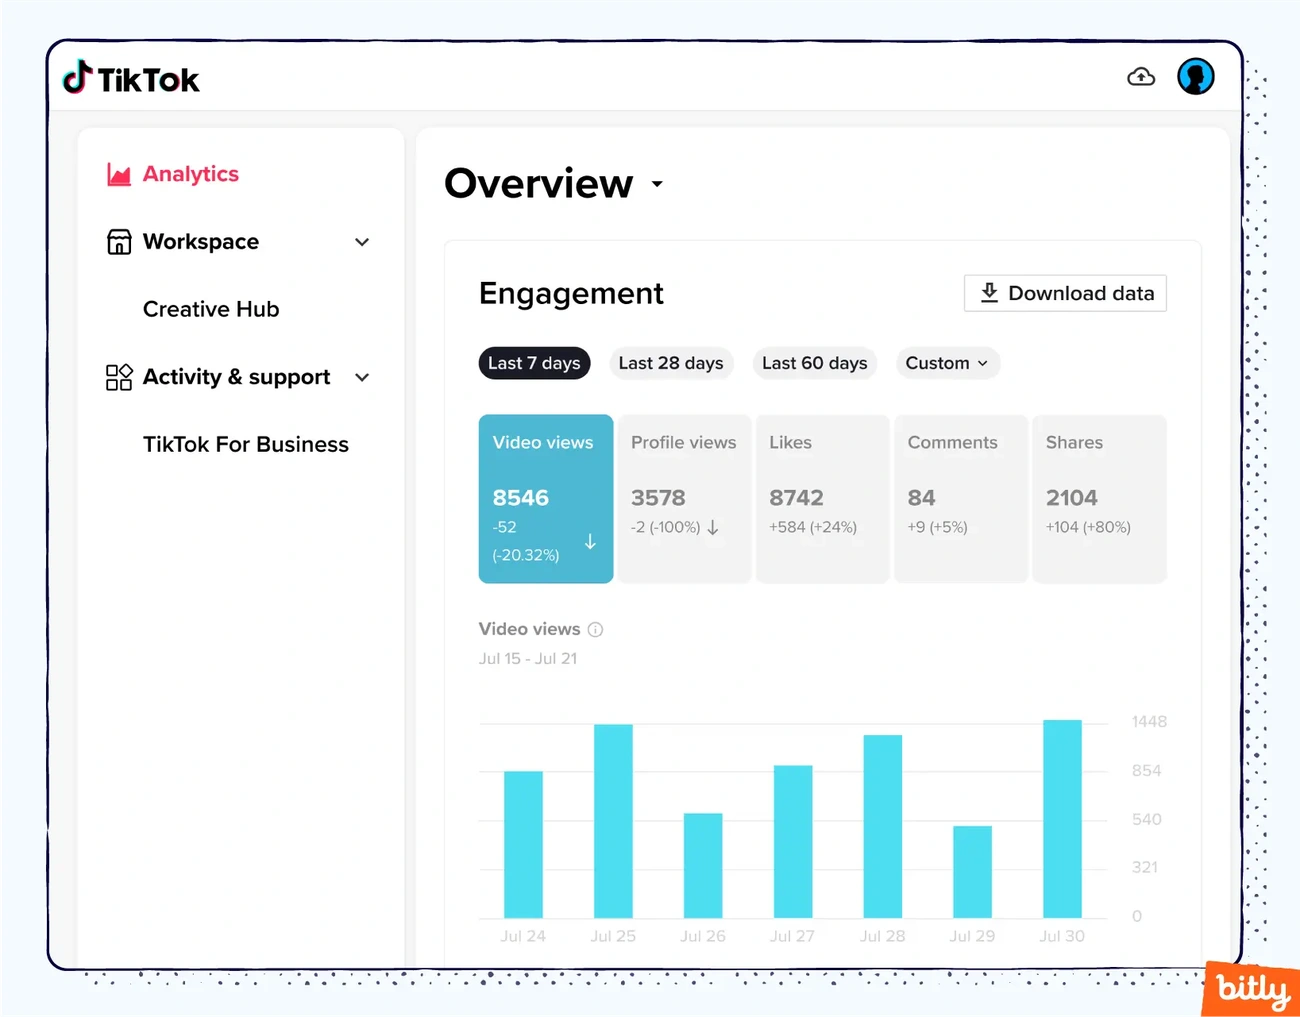
Image Source: Bitly
TikTok analytics won't be available until you set up your account properly. Let me show you how to check your metrics on any device.
Switching to a Pro or Business account
You'll need a Pro or Business account to check your tiktok insights. Regular personal accounts can't access analytics. The switch is pretty simple:
- Open the TikTok app and tap your profile icon
- Tap the menu button (three lines) in the top right
- Select "Settings and privacy"
- Tap "Account" or "Manage Account"
- Select "Switch to Business Account" and follow the prompts
Remember that analytics only become available after you publish at least one public post.
Steps to access analytics from the TikTok app
The tiktok analytics dashboard is easy to find on your mobile once you've got your Business or Pro account set up:
- Open TikTok and go to your profile
- Tap the three-line menu in the top right corner
- Select "Creator Tools" then "Analytics" or Tap "TikTok Studio" and find the Analytics widget
You'll see several tabs including Overview, Content, Viewers, Followers, and LIVE metrics. These tools help you understand what tiktok analytics show and how well your content performs.
How to use TikTok Studio or Business Suite
TikTok Studio and Business Suite give you even more ways to track your performance:
On Mobile: TikTok Studio shows you a detailed dashboard with post views, net followers, and likes. The Analytics widget sits at the top with engagement metrics for your recent posts. Just tap "View all" to see more data.
On Desktop: Head to tiktok.com/analytics while logged in, or hover over your profile photo and click "View Analytics" or "Business Suite." The desktop version lets you download your data straight to your computer for deeper analysis.
The desktop Business Suite reveals more details about your audience metrics and content performance. You can also pick custom date ranges (7, 28, or 60 days) to spot trends and better understand your TikTok analytics.
Breaking Down the TikTok Analytics Dashboard
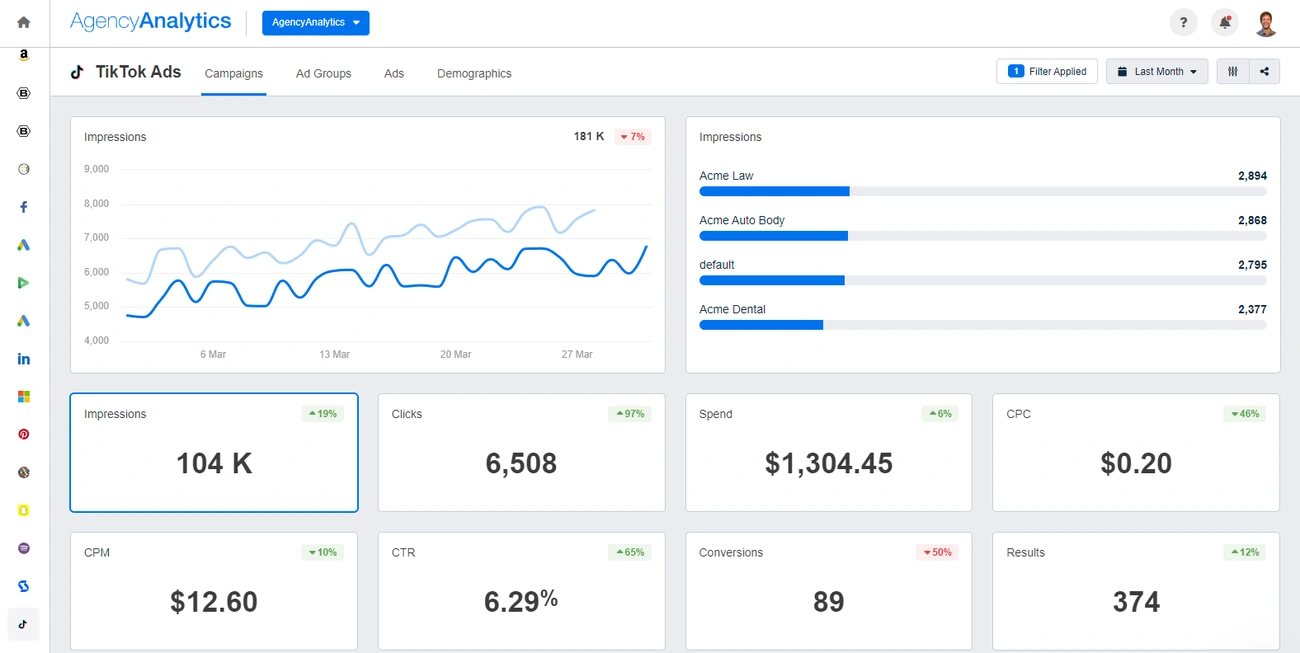
Image Source: AgencyAnalytics
The TikTok analytics dashboard splits your performance data into four main tabs that give you different ways to understand your content strategy and how people interact with it. Let me walk you through what each section tells you about your TikTok presence.
Overview tab: profile views, video views, likes
Your analytics command center lives in the Overview tab, where you can see all your key performance numbers during any time period you choose. You'll see video views, profile views, likes, comments, shares, and unique viewers. These numbers go beyond simple stats and show how much you've grown compared to before, which helps you spot patterns in your account's progress.
The number of profile visits shows how many users checked out your page, which tells you if your content makes people curious about your brand. Your total reach comes from video views, while engagement numbers (likes, comments, shares) show how well your content appeals to viewers.
Content tab: top videos, watch time, traffic sources
The Content tab shows your most successful videos, with a special "Trending Videos" section featuring your nine videos that gained views fastest in the last week. Each video shows you:
- Average watch time: The typical length people watch your content
- Total play time: How many hours all viewers spent on your video
- Retention rate: How many viewers watched until the end
- Traffic sources: Where your viewers came from
The traffic source numbers are really helpful because they tell you if people found you through the For You Page (algorithm picks), your profile, following feed, hashtags, or search terms.
Followers tab: demographics, activity times
The Followers tab tells you everything about who watches your content. You'll see your total followers, whether you gained or lost followers, gender mix, age groups, and where most viewers live - both countries and cities.
The tab's "Most Active Times" graph is super useful - it shows exactly when your followers usually browse TikTok, hour by hour and day by day. This helps you pick the best times to post so more of your followers see your content.
LIVE tab: live video performance metrics
Creators who run TikTok LIVE streams get detailed performance numbers here. The tab tracks total views, how long you broadcast, new followers you gained while live, peak viewer count, and unique viewers.
You can also track "Diamonds" (virtual gifts that turn into real money) and see which followers sent the most gifts and watched most often. These numbers help you figure out if your live streams are a good way to grow and connect with viewers.
How to Read TikTok Analytics and Use It for Growth
Raw TikTok analytics need more than just number-checking to create practical growth strategies. Here's how you can extract meaningful insights and put them to good use.
Identify your best-performing content
The Content tab shows which videos appeal most to your audience. You should look beyond basic view counts and understand how likes, comments, shares, and saves spread across your popular posts. Videos might get many views but fall short on engagement, while others with strong engagement point to content worth creating again. Take time to study your top performers and spot common elements - the video length, format, audio, or subject matter that keeps getting results.
Find the best time to post
Your reach and engagement depend heavily on timing. The "Most active times" section on the Followers tab shows when your audience browses TikTok. You can maximize your visibility by:
- Looking at hourly and daily patterns in follower activity
- Scheduling content right before peak times
- Testing different posting windows over several weeks
- Seeing which videos gain traction fastest
This approach helps you create posting schedules that match your audience's habits.
Track follower growth and engagement rate
Keep an eye on your follower count to see how well your content performs. You can find your engagement rate by dividing total interactions (likes + comments + shares + saves) by total views, multiplied by 100. To name just one example, a video with 54,000 views and 6,150 total interactions shows an 11.39% engagement rate. These metrics help you spot what makes your audience grow.
Use insights to refine your content strategy
Testing different content formats reveals what connects with your audience. Try various video lengths, editing styles, and topics while measuring performance. Your demographic data might show that 88% of viewers are aged 18-34, so you can adjust your content's pace, references, and tone. Watch times and completion rates highlight viewing patterns - if people drop off at certain points, those sections need changes in future videos.
Conclusion
TikTok analytics helps you move from guesswork to evidence-based decision making for your content strategy. This piece explores how TikTok's metrics give you vital insights about your audience and content performance. These insights help you understand your video viewers, high-performing content, and your followers' active platform times.
Analytics act as your growth roadmap on TikTok. Time spent analyzing metrics like video completion rates, traffic sources, and demographic data leads to better-targeted content. The patterns you find through regular analysis let you copy success instead of blindly following trends.
Numbers paint a picture of your audience. Engagement rates show content that connects deeply, and follower activity times point to the best posting windows. Performance tracking over time helps you spot rising trends early.
Success on TikTok comes from understanding your analytics, adjusting your approach based on data, and creating content your audience wants. These analytics practices will likely improve your TikTok performance within weeks if you start today.
Comments (0)