即時処理
公開リンクを貼り付け、結果をプレビューしてダウンロード — デスクトップソフト不要。


無料 · 登録不要 · 最新10本の動画
このツールの理由
最新の公開動画のいいね、コメント、シェア、保存からエンゲージメント率を表示 — 登録不要。
公開リンクを貼り付け、結果をプレビューしてダウンロード — デスクトップソフト不要。
アプリや拡張機能のインストール不要。デスクトップとモバイルで動作します。
無料ツールと本物のエンゲージメントを組み合わせ、共有コンテンツがより多くの人に届くようにします。
個人利用のみ。著作権と各プラットフォームの利用規約を尊重してください。GTRSocialsは第三者プラットフォームと提携していません。

TikTokは、エンゲージメントが通常フォロワー数に対して測定されるInstagramやFacebookとは異なります。TikTokのアルゴリズムは、あなたをフォローしていない人々に動画をプッシュするため、実際に重要なのは、あなたのコンテンツがそれを見た人々に対してどのようにパフォーマンスを発揮するかです。フォロワーに対してではありません。
これらの基準は、あなたのニッチによって少し変わることがあります — コメディやダンスコンテンツは通常より高い傾向がありますが、B2Bや教育アカウントはしばしば低めに位置し、それは完全に正常です。このスケールを一般的な指針として使用し、厳密なルールとしては考えないでください。
この公式はシンプルで、クリエイター、エージェンシー、ブランドがTikTokのパフォーマンスをベンチマークするために使用するのと同じものです:
動画のすべてのインタラクションを合計します — いいね、コメント、シェア、保存 — その合計をビューの数で割り、100を掛けてパーセンテージを取得します。上の計算機に自分の数字を入力すると、瞬時に計算され、どのバンドに属するかも教えてくれます。
保存は、TikTokのアルゴリズムが注目する最も強力なシグナルの1つです。動画を保存することは、誰かがそれを再度見たいと思っていることを意味します。控えめないいね数でも、健康的な保存数を持つ動画は、コンテンツが本当に価値のあるものであることを示すサインであり、時間をかけて数字を追跡する際に注目すべきです。
フォロワー数をスコアボードのように扱いたくなるかもしれませんが、同じフォロワー数の2つのアカウントが全く異なる影響力を持つことがあります。10,000人のフォロワーと7%のエンゲージメント率を持つクリエイターは、100,000人のフォロワーと1%の率を持つクリエイターよりも、はるかに効果的に人々に影響を与えています。ブランド、スポンサー、そしてTikTokのアルゴリズム自体もその違いに気づきます。
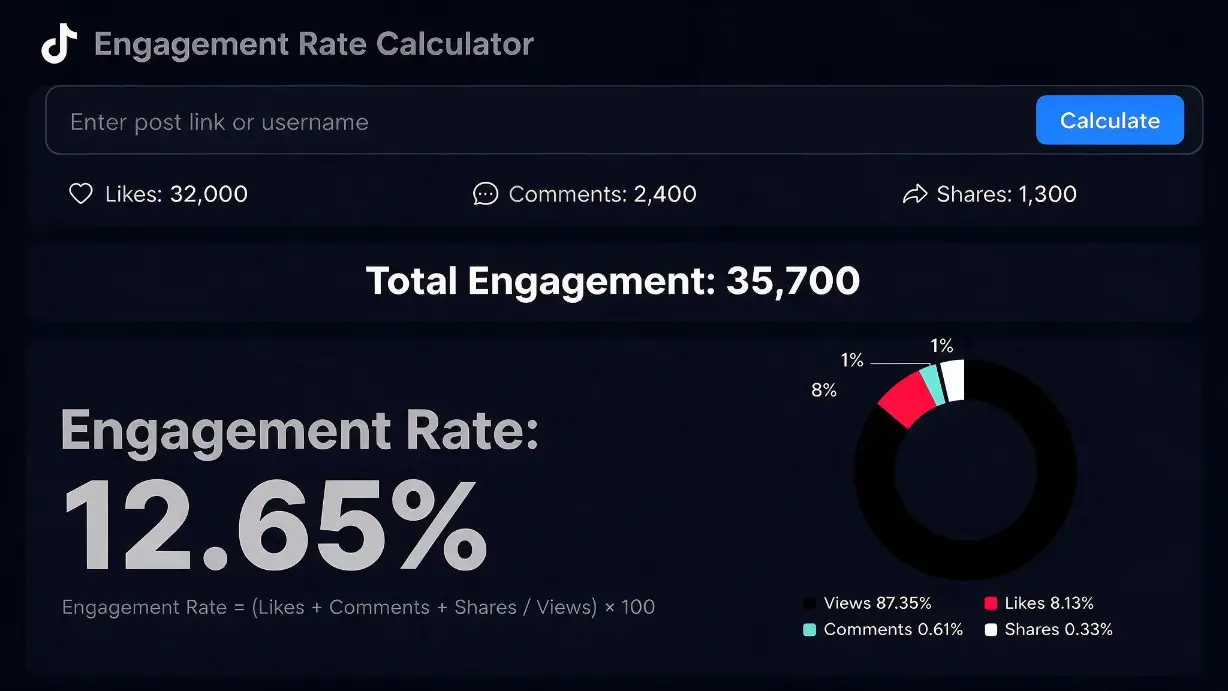
いいね、コメント、シェア、保存を並べて追跡することで、全体のエンゲージメントの状況がわかります
これが、新しいアカウントや新しく投稿された動画がしばしば苦労する理由でもあります。最初はほとんどビューやインタラクションがないため、アルゴリズムが測定するものが何もありません。すべてのアカウントは、いつかこのコールドスタートに直面します。それを乗り越えるアカウントは、早期に勢いを得て、その後も一貫して現れ続けるものです。
これらの方法は、コンテンツの再発明を必要としません。小さく、一貫した調整が、単一の「バイラルハック」よりも数値を動かす傾向があります。
もしあなたのレートが「低い」または「平均」の範囲にあるなら、それは通常、動画がアルゴリズムに気づかれるための十分な初期の勢いを得ていないことを意味します — またこのコールドスタートの問題です。ショートカットを考えるのではなく、少しの初期エンゲージメントをボールを転がすための手段として考えましょう:動画が「いいね」やコメント、シェアを集め始めると、それ自体でさらにそれらを引き寄せる可能性が高くなります。
動画の数字を動かす手助けが必要な場合、GTRSocialsは2013年からクリエイターやブランドがその初期の勢いを築くのを支援しています。TikTokや他の24のプラットフォームで。
必ずしもそうではありません。「平均」バンドのすぐ下に位置していますが、ニッチが重要です — 教育やB2Bアカウントでの3%の率は完全に良好ですが、コメディアカウントで同じ数字はコンテンツが受け入れられなかったことを意味するかもしれません。
どちらも有用です。動画ごとのデータは現在何が機能しているかを教えてくれます。一方、過去10〜20投稿の平均は全体のトレンドを示し、時間をかけて自分を比較する際により信頼性があります。
TikTokの配信はフォロワーリストではなく「For You」ページによって駆動されるため、視聴回数は実際にコンテンツを見たオーディエンスとのパフォーマンスをより正確に示します。
この公式では同等に重み付けされていますが、TikTokのアルゴリズムは「いいね」よりも保存や共有を強い意図の信号として扱う傾向があります。なぜなら、どちらも視聴者からの少しの努力が必要だからです。